ground-truth
Ground Truth App.
The pyodi ground-truth app can be used to
explore the images and bounding boxes that compose an object detection dataset.
The shape distribution of the images and bounding boxes and their locations are the key aspects to take in account when setting your training configuration.
Example usage:
pyodi ground-truth \\
$TINY_COCO_ANIMAL/annotations/train.json
The app is divided in three different sections:
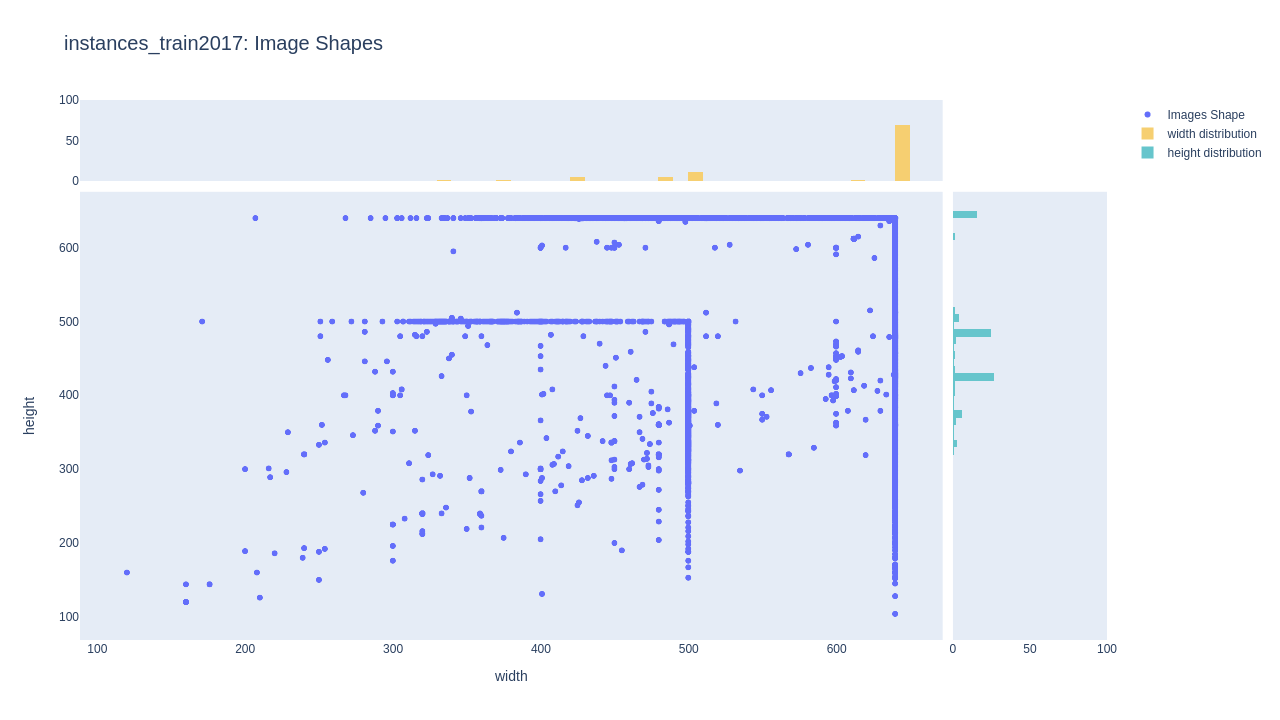
Images shape distribution
Shows information related with the shape of the images present in the dataset. In this case we can clearly identify two main patterns in this dataset and if we have a look at the histogram, we can see how most of images have 640 pixels width, while as height is more distributed between different values.
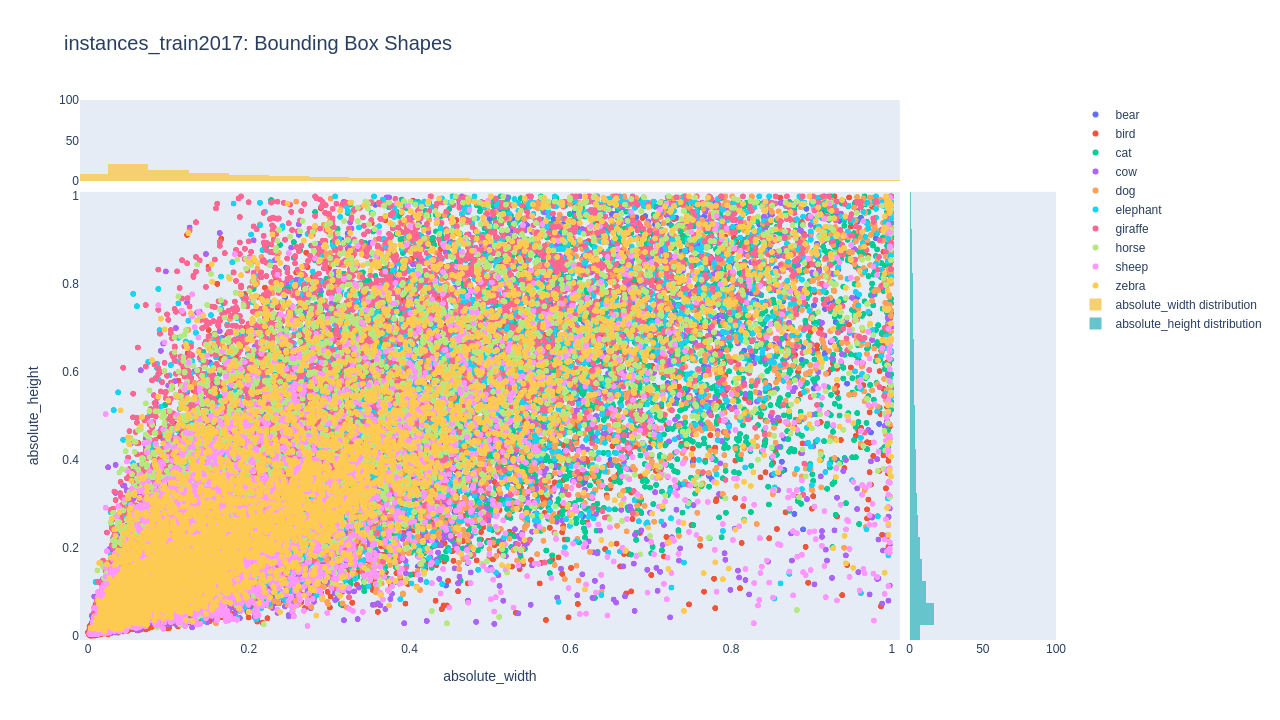
Bounding Boxes shape distribution
We observe bounding box distribution, with the possibility of enabling filters by class or sets of classes. This dataset shows a tendency to rectangular bounding boxes with larger width than height and where most of them embrace areas below the 20% of the total image.
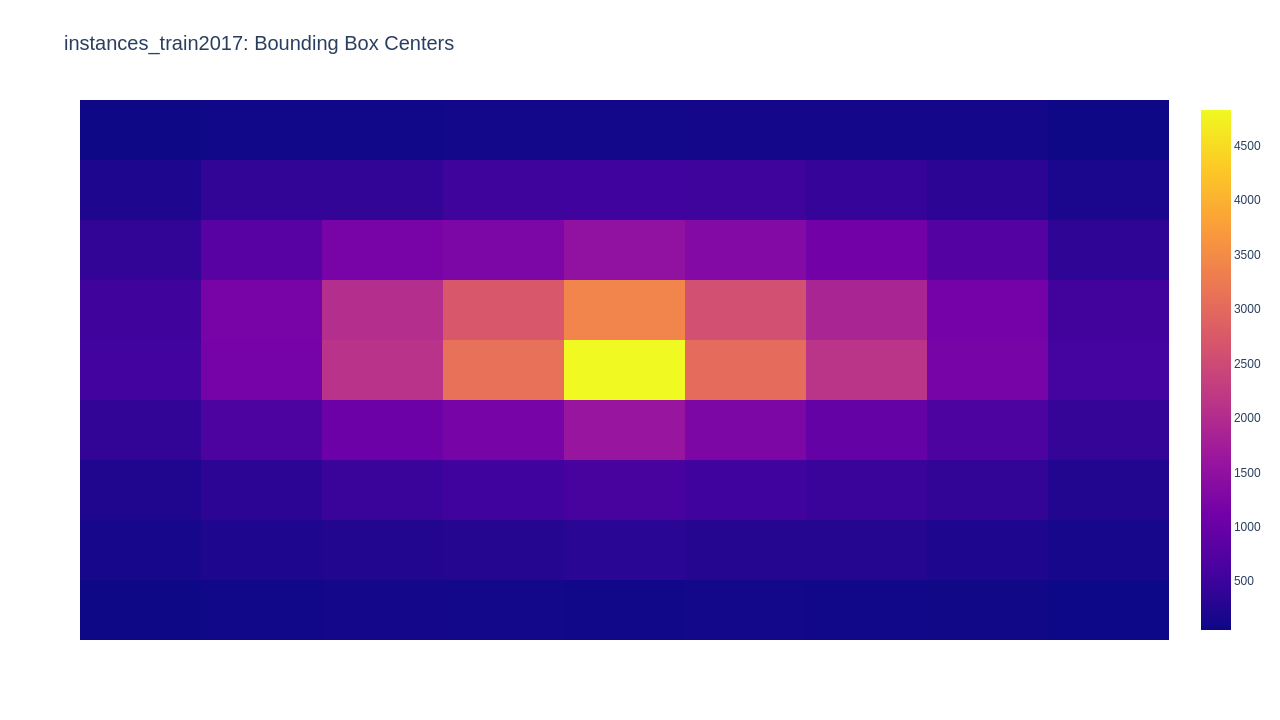
Bounding Boxes center locations
It is possible to check where centers of bounding boxes are most commonly found with respect to the image. This can help us distinguish ROIs in input images. In this case we observe that the objects usually appear in the center of the image.
API REFERENCE
ground_truth(ground_truth_file, show=True, output=None, output_size=(1600, 900))
Explore the images and bounding boxes of a dataset.
Parameters:
| Name | Type | Description | Default |
|---|---|---|---|
ground_truth_file |
str
|
Path to COCO ground truth file. |
required |
show |
bool
|
Whether to show results or not. Defaults to True. |
True
|
output |
Optional[str]
|
Results will be saved under |
None
|
output_size |
Tuple[int, int]
|
Size of the saved images when output is defined. Defaults to (1600, 900). |
(1600, 900)
|
Source code in pyodi/apps/ground_truth.py
57 58 59 60 61 62 63 64 65 66 67 68 69 70 71 72 73 74 75 76 77 78 79 80 81 82 83 84 85 86 87 88 89 90 91 92 93 94 95 96 97 98 99 100 101 102 103 104 105 106 107 108 109 110 111 112 113 114 115 116 117 118 119 120 121 122 123 124 | |